How to Track Reels Performance Across Many Pages
Running 5 to 30 pages? Copy five metrics into one sheet every week, compare pages fairly, and use simple rules to scale, fix or pause.
In this article
The simplest way to track performance on multiple pages' Reels is to copy the same four or five metrics (plays, completion or watch time, shares, follows and eligibility status) from each page's Insights into one shared sheet every week. Then compare the pages side by side. No paid dashboard is needed, and it takes about 10 minutes per page once the routine sticks.
We've watched agencies open 20 Insights tabs every morning and still not know which page deserved attention. The problem isn't missing data. It's missing structure.
What to Track for Each Page
Track five numbers per page: plays, completion, shares, follows and monetization eligibility status. Add a format tag, and you can answer almost any question a client asks. Exact metric names vary by Meta interface version, so match the labels you see rather than the ones in this article.
Plays and reach
Plays (sometimes labelled views) show how often your Reels started. Reach shows how many unique accounts saw them. Log plays as your main volume number and treat reach as a backup.
Completion and average watch time
Average watch time and completion rate are your retention signals. They tell you whether the hook and pacing work. A Reel with 200,000 plays and weak watch time is a warning sign, not a win.
Shares, follows and engagement rate
Shares are the strongest signal that people care about a Reel. Follows show whether the audience sticks around. If you want engagement rate, divide likes, comments, shares and saves by reach and keep the method the same on every page.
Monetization eligibility status
Record the Facebook content monetization status for each page: eligible, in review, or a warning. Meta decides eligibility and the rules change, so check Meta's creator site for the current requirements. Never forecast earnings from the numbers.
Where to Find Reels Stats on Each Page
Reels stats live in the Facebook Professional dashboard and in Meta Business Suite Insights, and yes, Reels have a public view count. Insights go further than that count: they show plays, watch time and audience data for each Reel.
Professional dashboard and Meta Business Suite Insights
On mobile, open the page's Professional dashboard, tap Content, then open a Reel to see its stats. On desktop, Meta Business Suite lets you switch between pages you manage and pull Reels results by date range. The Meta Business Help Center has the current definitions of each metric, which is worth checking when labels change.
Instagram Reels, YouTube Shorts and TikTok each have their own analytics. Use the same columns for them and add a platform column. Don't mix platforms in one comparison, since a play on TikTok doesn't mean the same thing as one on Facebook.
Set Up a One-Sheet Dashboard for All Pages
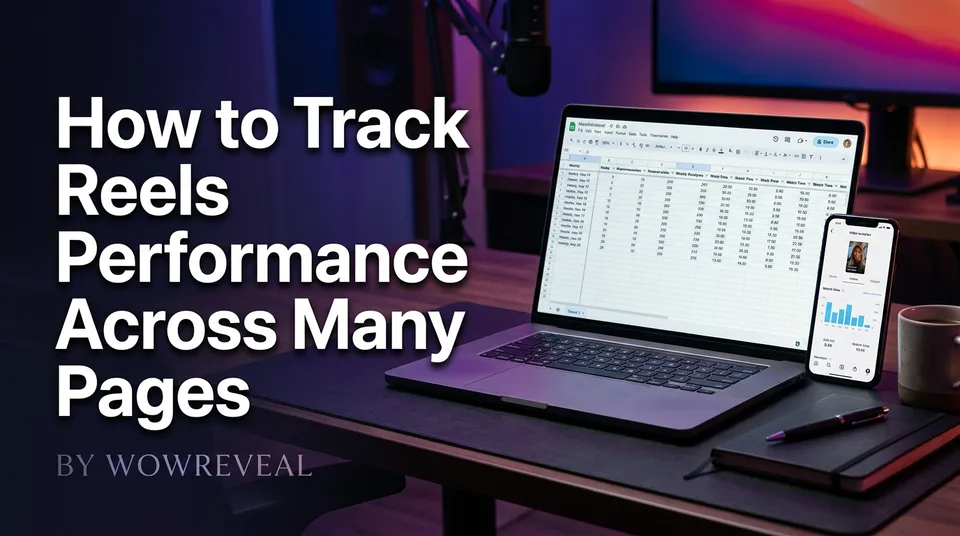
One Google Sheet with one row per page per week is enough for a reliable Reels analytics dashboard. Keep it boring. Boring sheets get filled in.
Columns to include
| Column | What goes in it |
|---|---|
| Page | Page name |
| Week | Start date of the 7-day window |
| Format | Main format posted that week |
| Posts | Number of Reels published |
| Plays | Total plays in the window |
| Watch time / completion | Average per Reel |
| Shares | Total shares |
| Follows | Net new follows |
| Eligibility status | Eligible, in review, warning |
| Notes | Anything odd, such as a warning or a trend sound |
Tagging each Reel by format and niche
Tag every Reel with its format (story voiceover, compilation, best moments clip) and its niche. Without tags you can only say a page grew. With them you can say which format earned the growth. When a format underperforms on completion, we usually look at the first 3 seconds and the captions before blaming the topic. Tools like WowReveal help here because its templates and AI Clipper keep formats consistent, which makes the tags comparable week to week.
Choose a Review Cadence
Use three rhythms: a daily glance, a weekly log and a monthly review. That keeps agency reporting for Reels manageable without drowning in numbers.
Daily glance, weekly log, monthly review
The daily glance takes 2 minutes. You're only checking for problems, such as a page with a new warning or a Reel that suddenly stopped getting plays. Don't log anything.
Log the numbers once a week, on the same day, using the same 7-day window for every page. Once a month, review the 28-day picture and decide where to put effort. Weekly numbers are noisy, and one viral Reel can distort a single week.
Compare Pages Fairly
Compare pages on per-post averages over the same window, never on raw totals. A page posting 21 Reels a week will beat one posting 7 on total plays, even if its content is weaker.
Use the same time window and normalize by posts per week
Divide plays, shares and follows by posts that week. Then compare watch time or completion directly, since it's already an average. Page size matters too, so look at plays relative to followers, not just absolute plays. Rank pages by completion and shares per post, and use plays as context rather than the verdict.
Decide Which Pages and Formats to Scale
Scale what holds attention and gets shared, not what simply collects plays. Decisions should come from rules you wrote before looking at the results.
Scale, fix or pause rules
- Scale: a format with above-median completion and shares across your pages for 2 to 3 weeks in a row. Post more of it, and copy it to a sister page in a different niche only if the content is original there.
- Fix: high plays but low completion. The thumbnail or hook draws people in, then the pacing loses them. Tighten the opening, cut the slow middle, and check the captions.
- Pause: flat results for 4 weeks, or any eligibility warning. Stop the format that preceded the warning and find out why before posting more.
Log every originality or monetization warning next to the format that was posted. This catches pages that look like duplicates of each other before Meta does. Rules can change, so reread the monetization policies on Meta's creator site now and then.
Turning the Sheet Into a Client Report
A client report is your sheet filtered to one page, with four weeks of trend and a short note on what you'll do next. Clients rarely want 30 columns. They want to know what worked and what changes.
Give them one line per metric: plays per post, average completion, shares per post and follows. Add the top format, the weakest format and the next step. State that all figures are estimates from Meta's Insights and that eligibility is decided by Meta. Never promise payouts. The trend line tells the story better than any forecast.
Frequently asked questions
Do Reels have a view count?
Yes. Facebook Reels show a public play or view count, and Insights add detail like watch time and reach. The label varies by interface version, so check the one in your dashboard.
How do I see views on Reels on Facebook?
Open the Professional dashboard on mobile, tap Content, then tap a Reel. On desktop, use Meta Business Suite Insights and filter by Reels and date range.
Can I use the same sheet for TikTok and Instagram Reels?
Yes, add a platform column and keep the same metrics. Compare pages within one platform, not across platforms, because each counts plays differently.
Where to go next
- What Is Facebook Professional Mode? Definition, Setup and Page Differences — the Professional dashboard is where each page's Reels insights live.
- How Many Views Do You Need to Get Paid on Facebook Reels? — helps you read the plays column against monetization thresholds.
- Niche Short-Video Formats: A Page Owner's Format Library — gives you the format tags to log and compare in the sheet.
- How to Stop Multiple Facebook Pages From Looking Like Duplicates — explains the originality risk your eligibility column should catch.
- Facebook Monetization Violations: What Gets a Page Restricted — what to do when the sheet shows a warning.
Generate your reel right now
Paste a link to any video — WowReveal writes the story, voices it and adds captions, a headline and music. Ready for Reels, Shorts and TikTok.



No link? Upload a file
- 30 free credits
- No card needed
- Voiceover in 9 languages
- Failed jobs refunded