How to Find Where Viewers Drop Off in Your Shorts (and What to Fix)
Open the retention graph, read the shape of the line, and match it to one specific edit. A cross-platform guide for YouTube Shorts, Facebook Reels, Instagram and TikTok.
In this article
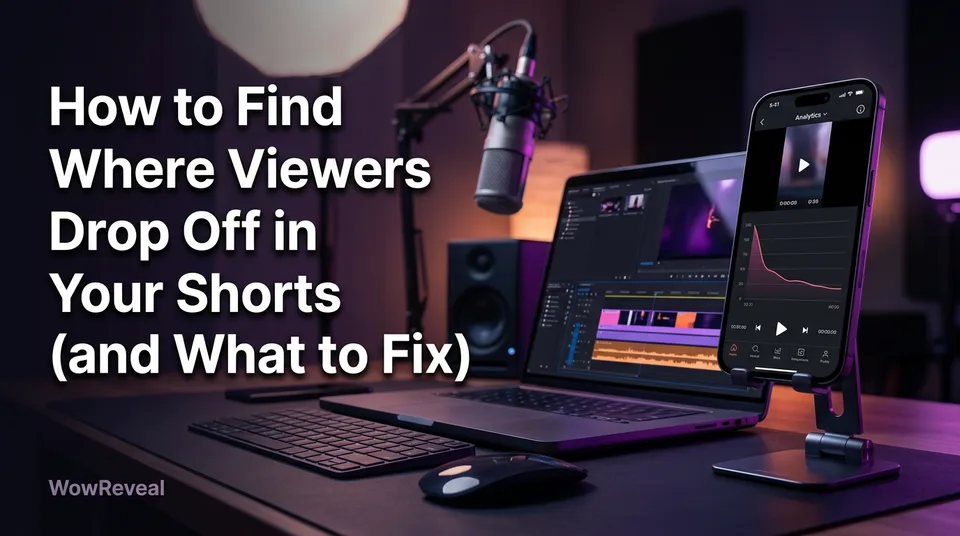
You see where people stop watching in the audience retention graph on each short's analytics page. In YouTube Studio, open the Short, then Analytics, then Engagement; Reels and TikTok have an equivalent retention view in their own analytics. The shape of that line, not the average number above it, tells you which part of the video to fix.
That's the whole answer to where viewers drop off shorts. The harder part is reading the line honestly. Loops inflate it, small view counts make it jumpy, and a sudden view crash often has nothing to do with it. Below: where to click on four platforms, how to avoid being fooled, five common shapes, one edit for each, and a retest routine.
Key takeaways
- The audience retention graph shows time on the horizontal axis and the share of viewers still watching on the vertical axis. Read the shape, not just the average.
- On YouTube Shorts, check Viewed vs swiped away first. It tells you how many people left before the video really started.
- Loops and replays can flatten the line or push it above 100%. A flat line isn't automatically good news.
- Five shapes cover most cases: early cliff, steady slope, mid-video dip, end cliff, and a flat or rising line. Each one suggests a hypothesis and one edit.
- Compare each short with your own last 10 to 20 shorts, change one variable per test, and don't treat any benchmark as a pass mark.
How to see where people stop watching your YouTube Shorts
On YouTube, the retention graph for a Short sits inside YouTube Studio, under that single video's Analytics, on the Engagement tab. Channel-level analytics won't show it. You have to open one video at a time.
Open the retention graph step by step in YouTube Studio
- Open YouTube Studio on desktop. The mobile app shows less detail, so use a laptop for real analysis.
- Go to Content, then switch to the Shorts tab.
- Click the Short you want to inspect, then choose Analytics.
- Open the Engagement tab.
- Scroll to the audience retention graph and hover along the line to see the percentage at each second.
The line starts at the left when the video begins and ends at the right when it finishes. YouTube documents how this report works in its audience retention help page, including how it handles rewatches. Labels and layout change from time to time, so if a tab has moved, search the Analytics page for "retention" or "Viewed vs swiped away".
'Viewed vs swiped away' and average percentage viewed
Viewed vs swiped away is the split between people who stayed on your Short and people who scrolled past it almost immediately. It's the cleanest read on your opening, because a swipe happens before any of your storytelling gets a chance.
Average percentage viewed tells you how much of the video the typical viewer watched. It's a useful single number for comparing two shorts of the same length. It's a poor diagnostic on its own, since a steady slope and a brutal first-second cliff can produce the same average. Always check the shape underneath it.
Finding the drop-off point on Reels, Facebook and TikTok
Facebook Reels, Instagram Reels and TikTok each show per-video retention data, but what you see depends on your account type, your region and the platform's current rollout. Treat the paths below as a starting point and check your own account.
Facebook Reels and Meta professional tools
For Facebook Reels, open Meta Business Suite (or the professional dashboard on your page), go to Insights, then Content, and click an individual Reel. Meta typically shows plays, average watch time and a retention view for Reels, with a chart of how viewership changes across the video.
Page owners running several pages should check each one separately. We've seen the same Reel layout show up differently across pages depending on account setup. If you can't find the chart, look for average watch time at minimum and compare it with video length.
Instagram Reels insights
On Instagram, open the Reel from your profile and tap View insights. Instagram Reels insights usually list plays, watch time and average watch time, and on some accounts a skip rate (the share of viewers who left within the first moments). A professional account is generally required.
Where skip rate appears, it plays the same role as Viewed vs swiped away on YouTube. It's your opening report card. Where it doesn't, average watch time against the video's length gets you most of the way.
TikTok video analytics
On TikTok, open your video, tap the three-dot menu and look for Analytics. TikTok analytics commonly shows total play time, average watch time, the share who watched the full video, and a retention graph by second. Some of these need a Creator or Business account, and availability varies.
The pattern is the same everywhere. One video, one retention view, one question: at which second does the line fall hard?
How to read a retention graph without being fooled
A retention graph is a relative picture, not a verdict. The same line can mean different things depending on loops, view counts and what your other videos look like.
Why loops and replays can flatten or lift the line
Shorts loop automatically. If someone watches your 12-second video twice, the platform may count that as more than 100% of the video watched, and the graph can climb above its starting level or stay suspiciously flat. YouTube's own documentation notes that rewatches can lift the line.
So a flat line has two readings. Either the video is gripping, or it's so short that it replays before people decide to leave. Check the video's length and the average percentage viewed together. A 9-second clip with a flat line tells you less than a 45-second clip with the same line.
Compare against your own last 10-20 shorts, not a universal benchmark
You'll find confident numbers online for what "good" retention is. We don't trust them, and neither should you. Format, length, niche and audience temperature all move the baseline.
Pull up your last 10 to 20 shorts in the same format and look at their average percentage viewed and the shape of their lines. Your question is whether this one is better or worse than your normal, and where.
Sample size matters too. A short with 200 views produces a jagged line where a handful of viewers swings the percentages. Wait until the line is smooth enough that one person leaving doesn't redraw it.
The common drop-off shapes and what each one suggests
Most retention lines fall into five shapes, and each points to a different part of the video. Treat every reading below as a hypothesis to test, not a diagnosis.
Cliff in the first 1-3 seconds
The line drops sharply at the very start, then levels off. It suggests the opening failed to earn the next second: a weak first frame, a slow lead-in, a spoken intro that restates the title. Viewed vs swiped away usually confirms it with a high swiped-away share.
A silver lining: people who survive the cliff often stay. If the rest of the line is healthy, your content works and your packaging doesn't.
Steady slope the whole way
The line declines evenly from start to finish with no single break. It suggests pacing: nothing is clearly wrong, but nothing pulls people forward either. Often the video is too long for its amount of story, or every beat has the same energy.
Dip in the middle
The line holds, then falls noticeably around one point. It suggests a slow, confusing or repetitive section. Scrub to that exact second and watch it as a stranger would. You can usually spot the culprit in one viewing: a setup that runs long, a clip that repeats, a caption that's hard to read.
Cliff right before the end
Strong retention that collapses in the final seconds suggests viewers leave once the payoff lands. That's less of a problem than it sounds. People got what they came for. It's a problem only when you wanted them to stay for a second beat, a call to follow, or a loop.
Flat or rising line from loops
A line that stays high, stays flat or climbs suggests replays. This is usually good, but verify it. If the video is very short, check that people aren't replaying because the story was unclear. Read it alongside comments and shares before celebrating.
How to fix each drop-off pattern
Each shape maps to one edit, and you should make only that edit. The table is the shortcut; the sections below explain the reasoning.
| Drop shape | Likely cause (hypothesis) | One edit to try |
|---|---|---|
| Early cliff, 1-3 seconds | Weak first frame or slow opening line | Start on the most striking frame and rewrite the first line |
| Steady slope | Even pacing, thin story for the length | Trim length by cutting the least interesting 20-30% |
| Mid-video dip | A slow, repeated or unclear section | Cut or tighten that section, add a visual change |
| End cliff | Payoff arrives, viewers leave | Move the payoff earlier or add a closing beat |
| Flat or rising line | Loops, very short video | Confirm it's real, then keep the format and test length |
Fixes for an early cliff: hook, first frame, opening line
Start the video on the moment, not the setup. If your best frame sits at second 8, make it second 0. Then rewrite the opening line so it states the tension in under 2 seconds: what's about to happen, or what's wrong.
Test the hook as a pair: first frame plus first line. Changing both at once muddies the result, so pick one for each test.
Fixes for slope and mid-video dips: pacing, captions, cuts, length
For a slope, cut length first. Shorter almost always beats longer when the story is thin, and trimming is the cheapest edit there is. For a dip, find the second where the line breaks and either remove that section or break it up with a cut, a zoom or a new visual.
Animated captions help here because they give the eye something to track while the story moves. Line breaks of a few words, highlighted on the spoken word, keep slow sections readable. They won't rescue a boring clip, though. If the dip is a dead stretch, cut it.
Fixes for an end cliff and for loop-friendly endings
If the line collapses at the end and you want retention past the payoff, move the reveal earlier and give viewers a reason to stay: a second beat, a twist or a final line. If you don't need anything after the payoff, leave it alone.
For loops, end on a frame that connects visually or verbally to the opening. A last line that flows back into the first frame makes the replay feel natural, not forced.
Drop-off inside a video vs views dropping suddenly
A sudden fall in views is often a distribution or topic-fit change, not an in-video retention problem. Retention describes what viewers do once they're watching. View counts also depend on how many people the platform shows the video to.
Before you edit anything, check two things. First, look at the retention graph of the affected shorts: has the shape actually changed compared with your earlier ones? Second, open traffic sources and see whether the Shorts feed (or Reels feed) share has collapsed. If retention looks the same and the feed share dropped, you're looking at distribution.
Distribution can move for reasons you don't control: a topic going stale, an audience shift, a format the platform tests differently. Forum threads are full of creators describing a breakout followed by a slump, and some report a rebound while others don't. There's no guaranteed recovery, so don't promise yourself one.
What you can do is keep your retention baseline solid and keep testing formats. And since sudden drops sometimes come from policy issues such as originality or reuse, run a pre-publish check for monetization-safety on every upload.
A simple weekly routine to test and confirm a fix
Change one variable, post comparable videos, and judge against your own recent shorts. That's the entire method. It's boring, and it works because it keeps you from fooling yourself.
- Pick one short with a clear shape problem and view count high enough for a smooth line.
- Write the hypothesis in one sentence, for example "the first line is too slow."
- Make one edit in the next comparable video: same niche, same length range, same posting time.
- Post and wait. Give each test enough views and several days before judging. Early numbers swing.
- Compare average percentage viewed and the shape against your last 10 to 20 shorts, not against one earlier video.
- Log the result: date, change, outcome, and what you'll try next. A shared spreadsheet is enough, and agencies running multiple pages should log per page.
If two things change at once, you've learned nothing. Resist the urge to also swap the music, the headline and the voice. Pick one.
Building retention fixes into your production workflow
Most retention problems are easier to prevent in production than to repair after posting. If you publish daily, you can't hand-edit every first frame, so the fixes need to be built into the workflow.
Three fixes carry most of the weight. First, pick stronger moments upfront: a tool such as the WowReveal AI Clipper finds the best moments in a long video, which cuts down mid-video dips caused by slow stretches. Second, add animated captions and a clear headline by default so pacing and readability don't depend on your mood that day. Third, if you build narrated story shorts, WowReveal's AI voiceover and story writing let you test a new opening line without re-recording anything.
Whatever tool you use, the retest routine stays the same. Tools speed up the edit. They don't replace reading your own graph. And any change should still pass your monetization-safety check, since platform rules change and each platform decides eligibility.
Frequently asked questions
How do I see where people stop watching my Shorts?
Open YouTube Studio on desktop, go to Content, then Shorts, click the video, then Analytics and the Engagement tab. The audience retention graph shows the percentage still watching at each second. Reels and TikTok offer an equivalent view inside their own video analytics, depending on account type.
Why do my Shorts views drop off suddenly?
Often it's a distribution or topic-fit change, not a problem inside the video. Compare the retention shape of the recent shorts with earlier ones and check traffic sources. If retention looks the same but feed exposure fell, editing the video itself may not help, and no rebound is guaranteed.
Can the retention graph go above 100% on Shorts?
Yes, it can. Shorts loop, and rewatches can lift the line above its starting point or keep it flat. Read it together with video length and average percentage viewed, because a very short video can look strong simply because it replays.
What is a good average percentage viewed for Shorts?
There's no universal pass mark. Length, niche and format change the baseline. Compare each short with your own last 10 to 20 in a similar format, and look at the shape of the line, not just the number.
How many views do I need before the retention graph is reliable?
There's no fixed figure. A graph from a few hundred views is jagged, because a few viewers can move the line. Wait until the line looks smooth, and avoid changing your format based on one low-view video.
Where to go next
- Short Video Retention: How to Get Reels and Shorts Watched to the End — the full retention system this diagnostic guide feeds into.
- What Is the 7-Second Rule on YouTube Shorts? — context for the early drop-off you'll see at the start of the graph.
- Hooks for Reels and Shorts: How to Win the First 3 Seconds — detailed fixes when you spot an early cliff.
- How Long Should a Clip Be for Shorts and Reels? — length trimming for slopes and end cliffs.
- Animated Captions for Reels: Do They Help Retention? — the caption fix for mid-video dips.
- AI Video Clipper: How It Finds the Best Moments in Long Videos — choosing stronger moments upfront prevents dips.
- Monetization-Safe Shorts: A Pre-Publish Checklist for Every Reel and Short — run this check alongside every retention fix.
- Why Shorts Get Demonetized and How to Appeal — useful when a sudden drop could be a policy issue.
- Facebook Reels vs YouTube Shorts vs TikTok: Where to Post to Earn — compare platforms once your retention is under control.
- Animated Captions for Shorts and Reels: Styles, Settings and Mistakes to Avoid
- How to Label AI-Generated Content on Reels, Shorts and TikTok
- YouTube Shorts vs Long-Form for Earning: How to Decide
Generate your reel right now
Paste a link to any video — WowReveal writes the story, voices it and adds captions, a headline and music. Ready for Reels, Shorts and TikTok.


No link? Upload a file
- 30 free credits
- No card needed
- Voiceover in 9 languages
- Failed jobs refunded